
HipScreen App Tutorials
Train yourself to use the HipScreen app in just two easy steps!
Step 1. Watch the three videos below, then test your learning.
Step 2: Take the competency test and review your answers against the answer key.
Aim for a score of 19 or better (80%).
Hip Surveillance Radiograph Interpretation (20 min.)
Hip Surveillance Radiograph Tutorial
Vedant Kulkarni:
Hello. My name is Vedant Kulkami and I'm a pediatric orthopedic surgeon at Shriners Hospitals for Children in Northern California. I'd like to go over with you today about the interpretation of hip surveillance radiographs using the HipScreen app. The American Academy for Cerebral Palsy and Developmental Medicine recently released guidelines for hip surveillance in children with cerebral palsy. Their study of the literature revealed that up to one in three children with cerebral palsy develop hip displacement and that timely diagnosis and treatment can improve function and reduce pain.
Hip Surveillance is the name of a program that seeks to identify hip disorders early for more effective treatment with regular X-rays and physical examinations obtained throughout childhood. Studies from Sweden, Australia, and other countries have shown that regular examinations and hip X-rays can prevent hip dislocation and improve function. Sweden has the longest published record of hip surveillance with the population based study spanning over 20 years.
The Swedish study showed that hip surveillance can effectively eliminate painful hip dislocations when applied across the entire population of children with cerebral palsy. The cornerstone of early identification of hip problems is a properly obtained X-ray called an anterior posterior pelvis X-ray. This X-ray is also called an AP pelvis X-ray. The most important measurement on this X-ray is the migration percentage or the percentage of the ball that is not covered by the socket.
A migration percentage over 30% of either hip increases the risk of continued displacement. Let's begin discussing how to interpret an AP pelvis X-ray. First, we'll need to be all speaking the same language. An AP pelvis X-ray shows both hips of the patient and gives the most information with the least radiation dose. All AP pelvis X-rays are displayed as if we were looking at the child in front of us.
We label the hips referring to the child so that when we say right hip, we are referring to the child's right hip, which is on your left. On X-rays, the bone appears white while cartilage, skin and fat appear gray or black. The more dense the bone, the whiter it appears. There are several important landmarks that are worth discussing. Many of these landmarks will be used when you determine the migration percentage. Let's go over them one by one.
The first landmark is the femoral head ossific nucleus, which is outlined with a black dotted line. This is the ball of the ball and socket hip joint. The dotted white lines outline the remainder of the femur. The two arrows are the innermost and outermost margins of the femoral head ossific nucleus, and our important landmarks for the measurement of migration percentage. The acetabulum is the socket of the hip, ball and socket joint and is outlined with black arrows.
The red arrows points to the outermost margin of the acetabulum and is another important landmark for measurement of the migration percentage. The part of the acetabulum that supports the weight of the body develops a thin white line called the sourcil. The acetabular sourcil is outlined with black arrows. Sourcil means eyebrow in French and that can help you remember the ideal shape of this radiographic landmark.
The acetabular teardrop is outlined with dotted lines and appears like a U-shaped white line. It is the innermost border of the acetabulum. The red arrow shows the bottom most portion of the teardrop, which is the most important landmark for measuring the migration percentage. I'll turn the dotted lines on and off so that you can see the white line better. Children's hips are growing from growth centers made of cartilage.
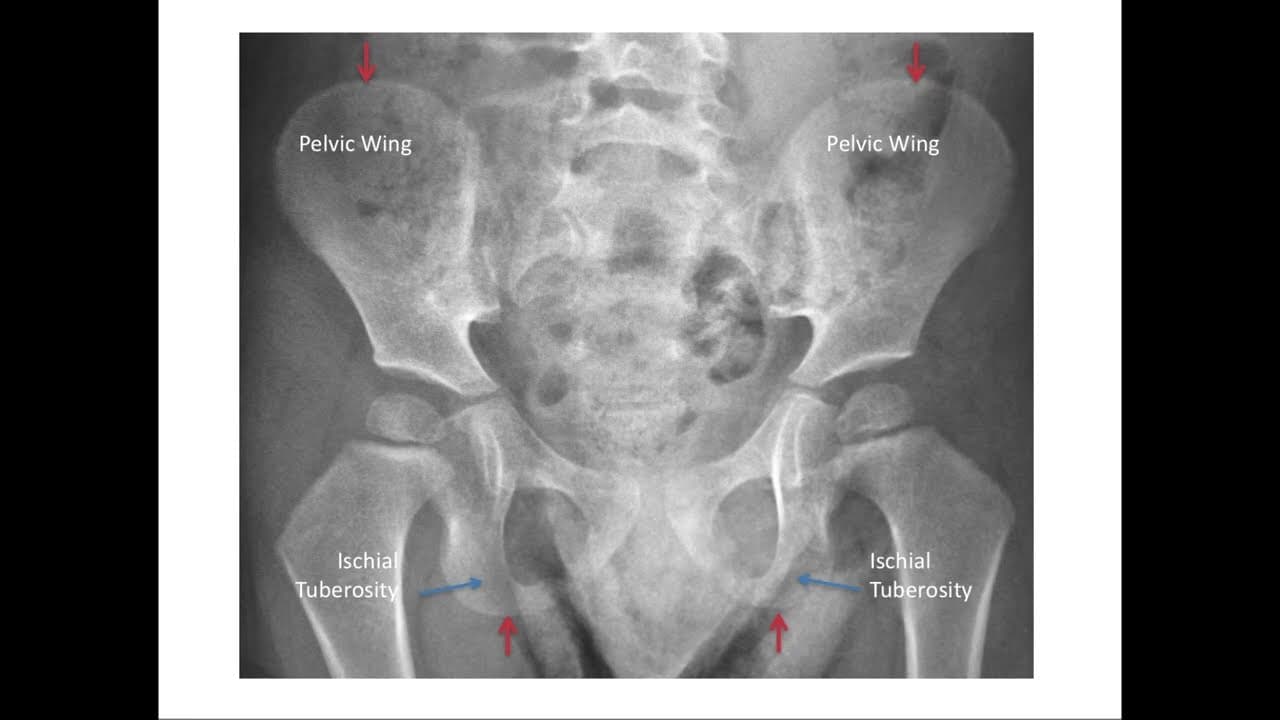
The tri-radiate cartilage is the growth center of the hip socket and appears as a thick line outlined here with arrows. The red arrow shows the outermost margin of the tri-radiate cartilage, another important landmark for measuring migration percentage. The pelvis has two other important landmarks, the pelvic wings and the ischial tuberosities, which are both labeled here. The red arrows mark the uppermost margin of the pelvic wings and the lowermost margin of the ischial tuberosities, and both of these can be used as landmarks for measurement of the migration percentage.
Finally, it's important to have a common language for discussing direction on an X-ray. We use the term medial to mean towards the center of the child and the term lateral to mean towards either side of the child. The radiographic landmarks I discussed earlier have medial and lateral borders as noted in this diagram. You'll notice that the medial and lateral terms are relative terms so that for example, the lateral extent of the tri-radiate cartilage is actually medial to the medial edge of the femoral head ossific nucleus.
The five landmarks seen here are the most important landmarks for measuring the migration percentage and are visible when the child is still growing with the tri-radiate cartilage still visible. Migration percentage is the most reliable quantitative measurement for hip surveillance and can be measured in four steps. The first step is to confirm that you have a properly positioned AP pelvis X-ray.
For proper X-rays the child should be positioned with the pelvis horizontal, the legs in neutral position and not crossing or spread apart, the knees extended as much as possible and the kneecaps or patella facing forward. If a hip flexion contracture is present, pillows should be used to keep the spine flat so that the pelvis is pointing straightforward. An appropriately positioned AP pelvis X-ray will have the following features, symmetric pelvic wings, hips and femur that are in neutral position and symmetric and oval obturator foramina.
The pelvis X-ray on the far left has all of these features. The pelvis in the middle X-ray has been rotated so that the pelvic wings are asymmetric and the obturator foramina are also asymmetric. In addition, both femur bones are abducted or spread out away from the body. The pelvis in the X-ray on the far right has been tilted forward, such as in a child with a hip flexion contracture and no positioning pillows under the legs.
This has created the view that shows the pelvic inlet well, but the hip landmarks are poorly seen. Notice that the obturator foramina are not oval and are hard to see. The second step is to establish the horizontal axis of the pelvis. Since not all children are placed exactly straight when the X-ray is taken, it's important to draw the horizontal or H-line as a reference line for the remainder of our measurements.
This can be done by connecting the tri-radiate cartilage of both hips outlined here in red. Either the lateral most extent of the tri-radiate cartilage or the medial most extent of the tri-radiate cartilage can be used, but it is important to choose the same part of the tri-radiate cartilage on both hips. If the tri-radiate cartilage cannot be seen, the lowest points of the acetabular teardrop can be used, outlined here in green. The third choice for the H-line is the lowest most point of the ischial tuberosities, outlined in orange.
The final choice is the uppermost portion of the iliac crest, outlined in blue. The H-line is more accurate the closer it is to the hips, so the tri-radiate cartilage is our first choice if it is visible. The third step is to draw three perpendicular lines to the H-line on each hip. The first line is the M-line, which intersects the medial most edge of the femoral head ossific nucleus.
The second line is the P-line, which intersects the lateral most edge of the acetabulum. Finally, the third line is the L-line, which intersects the lateral most edge of the femoral head ossific nucleus. The final step is to calculate the migration percentage for each hip by measuring two distances. Distance A is the distance between the L-line and the P-line and is the distance of the femoral head that has migrated beyond the edge of the acetabulum.
Distance B is the width of the femoral head. The migration percentage for each hip is distance A divided by distance B times 100. Let's go over some tricks to improve accuracy in determining your landmarks. In the X-ray on your left, the tri-radiate cartilage is easy to identify and the H-line can be easily drawn by connecting the same point on both tri-radiate cartilage.
The image on the right however, the tri-radiate cartilage is harder to identify. In this case, you can use another pelvic landmark to double check your H-line, such as a line connecting the inferior most point of the ischial tuberosities, highlighted here as a dotted line. As you can see, the two lines are nearly parallel, so it gives you confidence that your first line is more accurate.
If finding the edge of the tri-radiate cartilage is difficult, you can also use the intersection of the sourcil and tri-radiate cartilage. First, identify the sourcil and notice where it intersects the tri-radiate cartilage. The orange arrow points to the intersection and can be used to connect the two hips to create the H-line. The femoral head landmarks should also be chosen carefully to improve accuracy. Notice that in this case, the ossific nucleus of the femoral head is actually smaller than the neck of the femur just below it.
For consistency, always choose the edges of the ossific nucleus to draw your M and L lines. The edges are outlined here with orange arrows. The thicker black and white lines are the correct M and L lines, while the dotted thinner lines are the incorrect lines. Identifying the edge of the acetabulum can be challenging when there is a high variability in the shape and morphology of the acetabulum. Here are four examples of hips with vastly varying morphologies of the lateral acetabulum.
To improve reliability, we've created a flow chart that you can use to choose your landmarks. First, let's review the landmarks you'll want to pay attention to. As we discussed earlier, the sourcil is the weightbearing portion of the acetabulum and appears as a dense white line of bone outlined here with the black arrows. Sometimes the acetabular sourcil can upturn into an inverted V rather than a smooth contour.
Notice this upturn on the hip to your left, compared with the smooth curve of the hip on the right. This inverted V-shape is called a Gothic arch sourcil. I'll turn the highlighting on and off so you can better appreciate this difference. Finally, the lateral edge of the acetabulum is the bony edge of the acetabulum just before it upturns to meet the ilium, which is marked here with the red arrow. We've created this flow chart to determine the landmark that will be used for your P-line.
First, you'll need to determine if the entire sourcil is clearly visible to the edge of the acetabulum. If yes, you'll see if there's a Gothic arch. If no, you'll ask if the lateral edge of the acetabulum is clearly identifiable. Let's go through each case in detail. In the first and most common case, the sourcil will be clearly visible to the lateral edge of the acetabulum and there will be no Gothic arch.
In this case, use the lateral edge of the acetabulum as your landmark for the P-line. In the radiograph above, you see the hip without any annotations. In the image below, the crosshairs show the appropriate landmark for the P-line. If the sourcil is clearly identifiable to the lateral edge of the acetabulum and a Gothic arch is also clearly visible, then the apex of the Gothic arch should be used for the P-line.
Notice that the bony acetabular edge is more lateral and selection of that landmark would underestimate the migration percentage. The correct landmark is shown with the crosshairs. If the sourcil is not clearly identifiable to the bony edge of the acetabulum, as in this example, the lateral edge of the acetabulum should be used for the P-line. In this case, notice that there's a hint of a Gothic arch, but that because the sourcil is not clearly visible all the way out to the edge of the acetabulum, the lateral bony edge of the acetabulum is the correct landmark.
Finally, if there is significant difficulty in identifying the sourcil or the bony edge of the acetabulum, you'll need to use your clinical judgment to identify the lateral most edge as in this example. Let's walk through the steps of measuring the migration percentage with the HipScreen app's migration percentage ruler. From the main page of the HipScreen app, select the third tab for the migration percentage ruler.
Next, you can either take a photo with the camera or upload a photo from your library to HipScreen. If you take a photo within the HipScreen app, it will not save the photos on your device. To minimize any concern for health privacy, check out the hands-on tutorial for a live demonstration of each step in a different video. The first step after loading the photo is to rotate the image to level the pelvis to the H-line. First, select the rotate button.
Once you've selected the rotate button, notice that a new menu pops up. Use the CCW button to rotate the image counterclockwise and the CW button to rotate the image clockwise. You can use the touchscreen to pan and zoom the image appropriately. Once you finish leveling the pelvis to one of the four important landmarks, click the done button to return to the first menu.
You can use any of these four landmarks to level the pelvis, the tri-radiate cartilage, the inferior margin of the acetabular teardrop, the inferior margin of the ischial tuberosities, and the superior margins of the iliac crest. Once you've pressed the done button, then press the ruler button and this ruler overlay will appear.
Notice that the ruler has two sides that are mirror images of each other and that the appropriate side should be used for the appropriate hip. The left half of the ruler should be used for the image on your left, which is the patient's right hip. You can pan and zoom now until the hip appears on the ruler in the appropriate position. The appropriate position is that the white line touches the lateral margin of the femoral head ossific nucleus.
The black line should touch the medial margin of the femoral head ossific nucleus. When the femoral head is positioned this way, the vertical lines divide the femoral head into 10% increments. Although no numbers appear in the app, you'll notice that you can easily count by tens to find out what percentage of the femoral head is not covered by the acetabulum.
In this case, the fourth vertical line touches the edge of the acetabulum, so 40% of the femoral head is not covered by the acetabulum. The migration percentage is 40%. As you now know, a hip with the migration percentage over 30% is at risk for progressive displacement. If the lateral edge of the acetabulum of either hip is inside the red box, then the migration percentage is above 30%.
Let's go over some examples of what different migration percentages look like. The image above is without the ruler overlay, and the image below is with the ruler overlay. The yellow arrow marks the lateral edge of the acetabulum. In this example, the lateral edge of the acetabulum is between the first and second lines on the ruler, so the migration percentage is 15%.
In this next example, the lateral edge of the acetabulum is at the third line, so the migration percentage is 30%. Notice that it is at the edge of the red box. In this final example, the lateral edge of the acetabulum is at the fifth vertical line, so the migration percentage is 50%. For either hip, you count lines from the edge of the screen. In this case, the edge of the acetabulum is inside the red box, so you know the migration percentage must be above 30%. For more tutorials, visit HipScreen.org. Thanks so much.
Using the HipScreen Ruler - iOS (6:26 min.)
HipScreen Ruler Apple iOS Tutorial
Dr. Vedant Kulkarni:
Hi. My name is Vedant Kulkarni and I'm a pediatric orthopedic surgeon at Shriners Hospitals for Children in Northern California. Let's get started with a demonstration of how to use the HipScreen app on your Apple iOS device. After you open the HipScreen app, select the third tab to open the migration percentage ruler.
The first step is to load an X-ray onto the ruler. You can do this by selecting the camera icon to take a photo of an X-ray. To reduce any concerns of health privacy, if you take a photo of an X-ray within the HipScreen app, it is not saved to your device. If you already have taken a photo of your X-ray or your child's X-ray outside of the HipScreen app and have it saved on your device, you can use the photos button to load the photo into the app.
Let's start by taking a photo of a pelvis X-ray. We recommend that you stay in landscape mode when taking a picture of the X-ray so that it displays properly within the app. Press the use photo tab if you want to use this photo, or you can retake it as well. Once it displays, the next step will be to rotate the X-rays so that it is level.
Press the rotate button and a new menu will appear. You will notice that there are multiple gray horizontal lines across the screen. You'll use these lines to level the pelvis using one of the four landmarks we taught you in one of the previous tutorials. Let's use the triradiate cartilage, our top choice for landmark to level the pelvis in this example. Watch as I pan and zoom the image so that the landmark is more visible.
I'll use the CCW button to rotate the image counterclockwise and the CW button to rotate the image clockwise. It's correctly placed when the horizontal line goes through both triradiate cartilage in the same area. Here, I'm leveling it so that the horizontal line meets the lateral aspect of the triradiate cartilage on both hips.
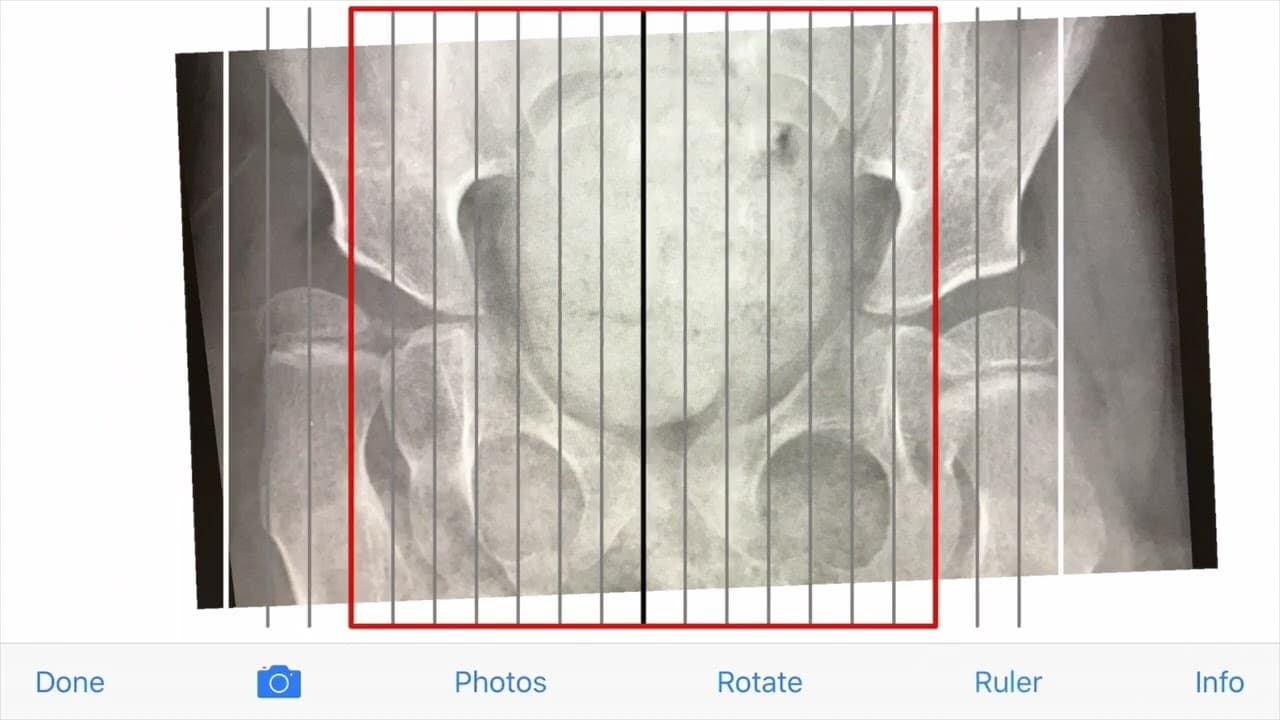
Once this is complete, I'll press the done button. Now my rotation is locked in and I can pan out of the image with the pelvis locked and leveled. The next step is to activate the ruler overlay so that we can measure the migration percentage of each hip. When I press the ruler button, an overlay appears.
Notice that as I zoom in on the image, the size of the ruler doesn't change. This allows us to fit the X-ray to the ruler, allowing for quick measurement of the migration percentage without moving lines on the screen. Notice that the ruler has two sides. We'll use the left half for the hip on the left half of the screen.
Now, I'll pan and zoom the image until the white line touches the lateral aspect of the femoral head, and the black line touches the medial aspect of the femoral head. One trick is to turn the ruler overlay on and off by pressing the ruler button so that you can double check that your landmarks are appropriately positioned on the ruler.
Once appropriately positioned, the femoral head is divided into 10% increments by vertical lines. The white line is the starting point for your measurement. Starting at the white vertical line, each gray line is a 10% increment of the femoral head. Notice that the third line is actually red. To measure the migration percentage, start at the white line and count which vertical line intersects the lateral edge of the acetabulum.
In this case, it is the sixth vertical line from the starting white line, so 60% of the femoral head is lateral to the edge of the acetabulum. The migration percentage is 60%. If the edge of the acetabulum falls between two gray lines, you can still estimate the migration percentage to the nearest percent.
Now, notice that the edge of the acetabulum is inside of the red box. If the lateral edge of the acetabulum is inside the red box on either hip, the migration percentage must be 30% or greater, and a referral to a pediatric orthopedic surgery specialty center for continued hip surveillance management is warranted.
Let's move to the right hip. Now, we'll repeat the same steps with the right half of the ruler. Again, we're trying to get the white line to touch the lateral aspect of the femoral head and the black line to touch the medial aspect of the femoral head. Now that the femoral head is appropriately positioned, notice that the third vertical line from the starting white line touches the edge of the acetabulum. It's the red line, so the migration percentage is 30%.
We can turn the ruler on and off to make sure that we agree with the placement of these lines, which seem to be accurate. The measurement of migration percentage using the migration percentage ruler can be fast and accurate. Visit www.hipscreen.org for more tutorials and information. Thanks.
Using the HipScreen Ruler - Android (6:20 min.)

HipScreen Ruler Android Tutorial
Vedant Kulkarni:
Hi. My name is Vedant Kulkarni, and I'm a Pediatric Orthopedic Surgeon at Shriners Hospitals for Children in Northern California. I'd like to get started with a demonstration of how to use the HipScreen app on your Android device. After you open the HipScreen app, select the third tab to open the migration percentage ruler. The first step is to load an X-ray onto the ruler. You can do this by selecting the camera icon to take a photo of an X-ray. To reduce any concerns of health privacy, if you take a photo of an X-ray within the HipScreen app, it is not saved to your device. If you have already taken a photo of your child's X-ray or your X-ray outside of the HipScreen app and have it saved on your device, you can also use the photos button to load the photo onto the app. Let's start by taking a photo of a pelvis X-ray. You can take the X-ray picture in landscape mode or in portrait mode.
Let's take a picture of this AP pelvis X-ray, by pressing the camera icon. I'll then press the check to select this X-ray for interpretation. Once it displays, the next step will be to rotate the X-ray so that it is leveled. Press the rotate button, and a new menu will appear. Notice that there are multiple gray horizontal lines across the screen. You'll use these lines to level the pelvis using one of the four landmarks we taught you in a previous tutorial. Let's use the triradiate cartilage, our top choice for landmark to level the pelvis in this example. Watch as I pan and zoom the image so that the landmark is more visible.
I'll then use the CCW button to rotate the image counterclockwise, and the CW button to rotate the image clockwise. I will do this until the horizontal line goes through the same part of the triradiate cartilage on both hips, although I won't use it in this example. You can press the 90 degree button to rotate the image a complete 90 degrees. This can be helpful if you start off in landscape mode or portrait mode, and want to switch to the other. Now that I'm satisfied with the rotation, I'll press the done button, and the orientation of the pelvis x\X-ray is locked. The next step is to activate the ruler overlay so that we can measure the migration percentage of each hip. When I press the ruler button, a ruler overlay will appear. Notice that as I zoom in on the image, the overlay size does not change.
This allows us to fit the X-ray to the ruler, allowing for quick measurement of the migration percentage without moving the lines on the screen. Also, notice that the ruler has two sides. We'll use the left half for the hip on the left half of the screen to start. Pan and zoom the image until the white line touches the lateral aspect of the femoral head, and the black line touches the medial aspect of the femoral head. One trick is to turn the ruler overlay on and off, so that you can make sure that you have the proper landmarks.
Once this is done, the femoral head is divided into 10% increments by vertical lines. The white line is the starting point for your measurement. Starting at the white vertical line, each gray line is a 10% increment of the femoral head. Notice that the third line is actually red. To measure the migration percentage, start at the white line and count which vertical line intersects the lateral edge of the acetabulum. In this case, it is the sixth vertical line from the starting white line, so 60% of the femoral head is lateral to the edge of the acetabulum. The migration percentage is 60%. If the edge of the acetabulum falls between two gray lines, you can still estimate the migration percentage to the nearest percent.
Now, notice the edge of the acetabulum is inside the red box. If the lateral edge of the acetabulum is within the red box, the migration percentage must be 30% or greater, and a referral to a pediatric orthopedic surgery specialty center for continued hip surveillance management is indicated. Let's go to the right hip now. We'll repeat the same steps on the right half of the ruler.
I will move the image and adjust it so that the medial aspect of the femoral head touches the black line, and the lateral aspect of the femoral head touches the white line. I'll again turn the ruler overlay on and off, to make sure the landmarks are appropriately positioned. Now that the femoral head is appropriately positioned, notice that the third vertical line from the starting white line touches the edge of the acetabulum. It's the red line. So the migration percentage is 30%.
You'll find more resources on www.hipscreen.org. Thanks so much.
Improve Your HipScreen Ruler Accuracy
Understand the Guidelines
- Frequently Asked Questions about Hip Surveillance
- Hip Surveillance Guidelines (Overview, AACPDM Care Pathway, Australian Guidelines (2014), British Coumbia Statement, Swedish CPUP Guidleines)
- Understanding Level of Function in Children with Cerebral Palsy: Overview of the Gross Motor Function Classification System
Keep In Touch
Join our mailing list to stay up to date on everything that's happening at Shriners Children's.